
VisText: A Benchmark for Semantically Rich Chart Captioning


The Annual Meeting of the Association for Computational Linguistics (ACL), 2023
Outstanding Paper Award
Abstract
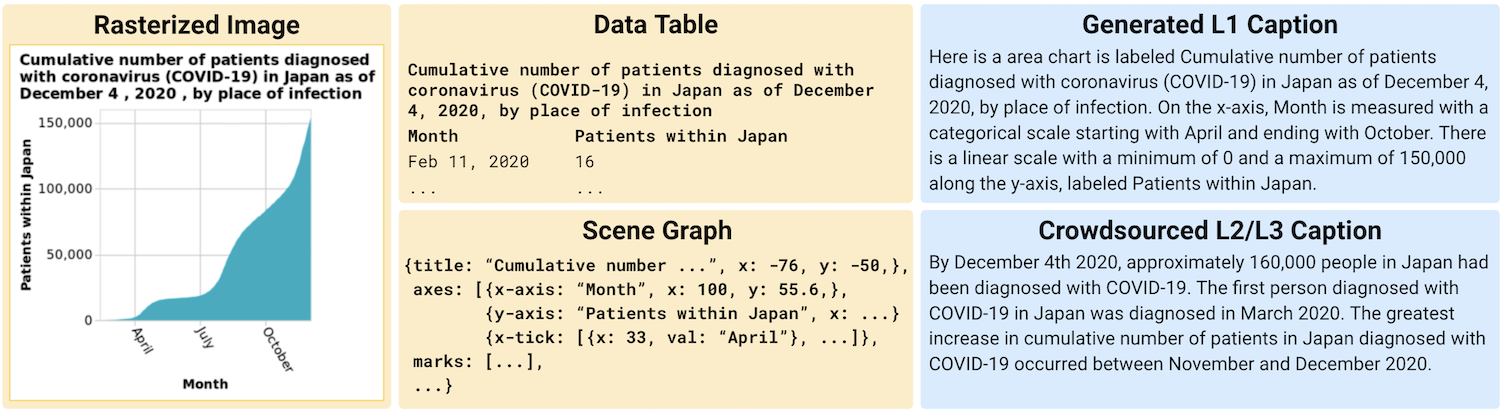
Captions that describe or explain charts help improve recall and comprehension of the depicted data and provide a more accessible medium for people with visual disabilities. However, current approaches for automatically generating such captions struggle to articulate the perceptual or cognitive features that are the hallmark of charts (e.g., complex trends and patterns). In response, we introduce VisText: a dataset of 12,441 pairs of charts and captions that describe the charts’ construction, report key statistics, and identify perceptual and cognitive phenomena. In VisText, a chart is available as three representations: a rasterized image, a backing data table, and a scene graph — a hierarchical representation of a chart’s visual elements akin to a web page’s Document Object Model (DOM). To evaluate the impact of VisText, we fine-tune state-of-the-art language models on our chart captioning task and apply prefix-tuning to produce captions that vary the semantic content they convey. Our models generate coherent, semantically rich captions and perform on par with state-of-the-art chart captioning models across machine translation and text generation metrics. Through qualitative analysis, we identify six broad categories of errors that our models make that can inform future work.