Tactile Vega-Lite: Rapidly Prototyping Tactile Charts with Smart Defaults
ACM Human Factors in Computing Systems (CHI), 2025 DOI

Mengzhu (Katie) Chen
MIT CSAIL

Isabella Pedraza Pineros
MIT CSAIL

Arvind Satyanarayan
MIT CSAIL

Jonathan Zong
MIT CSAIL
Abstract
Tactile charts are essential for conveying data to blind and low vision (BLV) readers but are difficult for designers to construct. Non-expert designers face barriers to entry due to complex guidelines, while experts struggle with fragmented and time-consuming workflows that involve extensive customization. Inspired by formative interviews with expert tactile graphics designers, we created Tactile Vega-Lite (TVL): an extension of Vega-Lite that offers tactile-specific abstractions and synthesizes existing guidelines into a series of smart defaults. Pre-defined stylistic choices enable non-experts to quickly produce guideline-compliant tactile charts. Expert users can override defaults to tailor customizations for their intended audience. In a user study with 12 tactile graphics creators, we show that Tactile Vega-Lite enhances flexibility and consistency by automating tasks like adjusting spacing and translating braille while accelerating iterations through pre-defined textures and line styles. Through expert critique, we also learn more about tactile chart design best practices and design decisions.
Bibtex
@inproceedings{2025-tactile-vega-lite,
  title = {{Tactile Vega-Lite: Rapidly Prototyping Tactile Charts with Smart Defaults}},
  author = {Mengzhu (Katie) Chen AND Isabella Pedraza Pineros AND Arvind Satyanarayan AND Jonathan Zong},
  booktitle = {ACM Human Factors in Computing Systems (CHI)},
  year = {2025},
  doi = {10.1145/3706598.3714132},
  url = {https://vis.csail.mit.edu/pubs/tactile-vega-lite}
}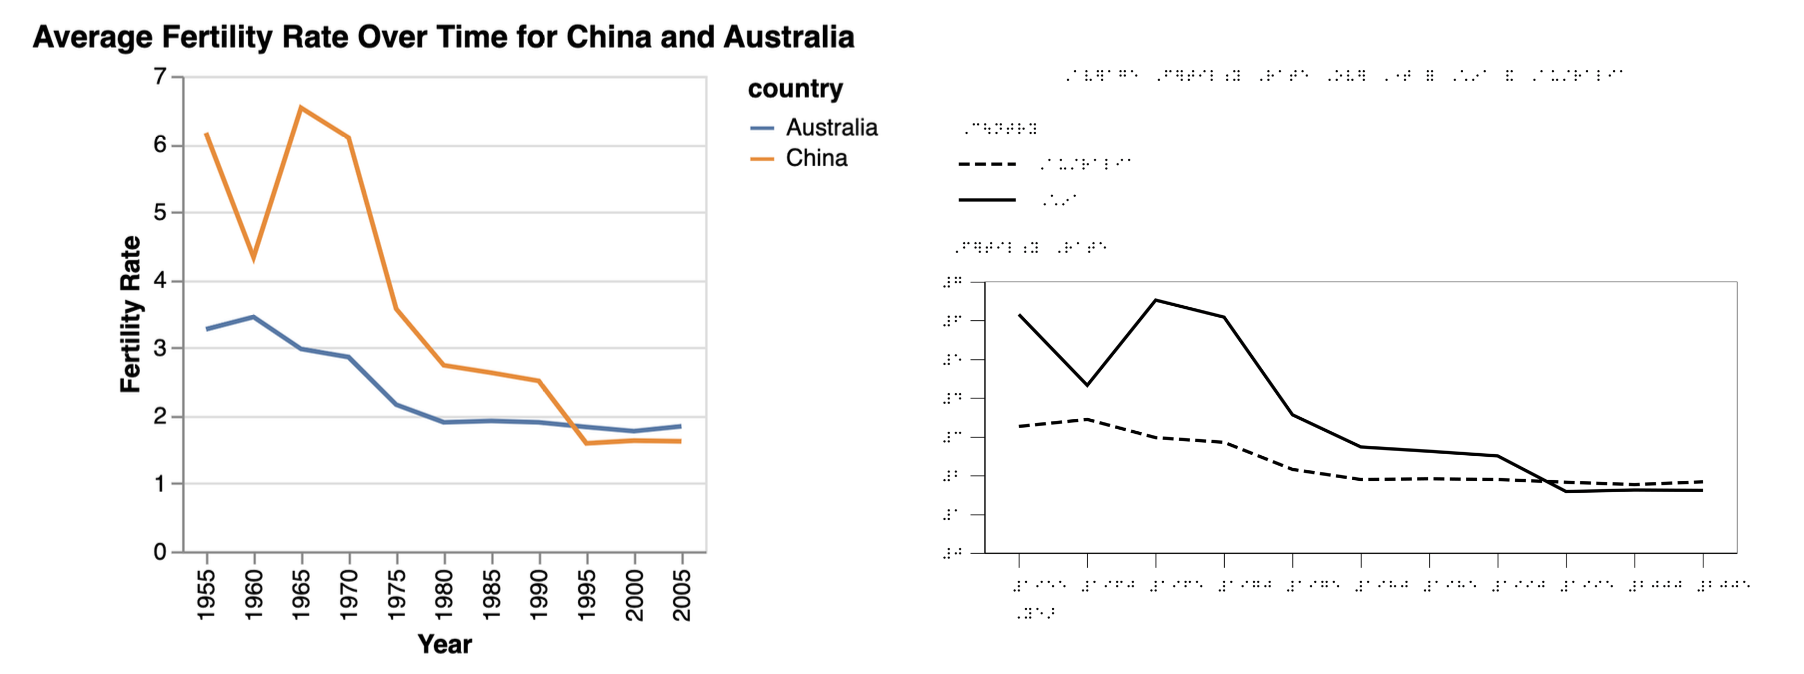
Comparison of visual and tactile charts representing fertility rate trends for China and Australia from 1955 to 2005. This comparison shows design considerations necessary when transforming visual data into tactile formats, such as converting text to braille, adjusting scaling and spacing of chart elements, re-arranging the legend, and substituting visual encodings with tactile encodings.